

Share this article:
.svg)


.svg)
.svg)

Key Takeaways from this article
- Value Stream Mapping creates clarity by making material and information flow visible as one system, exposing waste, bottlenecks, and missed value.
- The real value of VSM is not the map itself, but the ability to design a better future state with stronger flow, less waste, and clearer execution.
- Strong value stream maps connect customer value to process reality by showing which steps create value and which only consume time, resources, and attention.
- Improvement gains traction when teams analyze the current state rigorously, define a realistic future state, and translate that gap into a concrete action plan.
- Value Stream Mapping delivers the most impact when visual analysis, process data, cross-functional collaboration, and continuous monitoring work together.
Streamline, optimize, and deliver—these are the pillars of a successful business.
Value Stream Mapping (VSM) can be your strategic tool for seeing through the chaos and sculpting order from it. You won`t be only able to cut costs or trimming timelines, you'll elevate the quality and efficiency of what you deliver to your customers.
VSM lays everything on the table: the raw materials, the processes, the end product.
How can Value Stream Mapping transform your operational processes to maximize value creation and how is the mapping process executed?
This article will guide you through everything you need to know about VSM. We’ll cover why it’s essential, how it connects with lean principles to reduce waste, and the steps to create a value stream map yourself. Plus, we’ll dive into practical tools, challenges and examples to help you get started.
What Exactly is Value Stream Mapping?
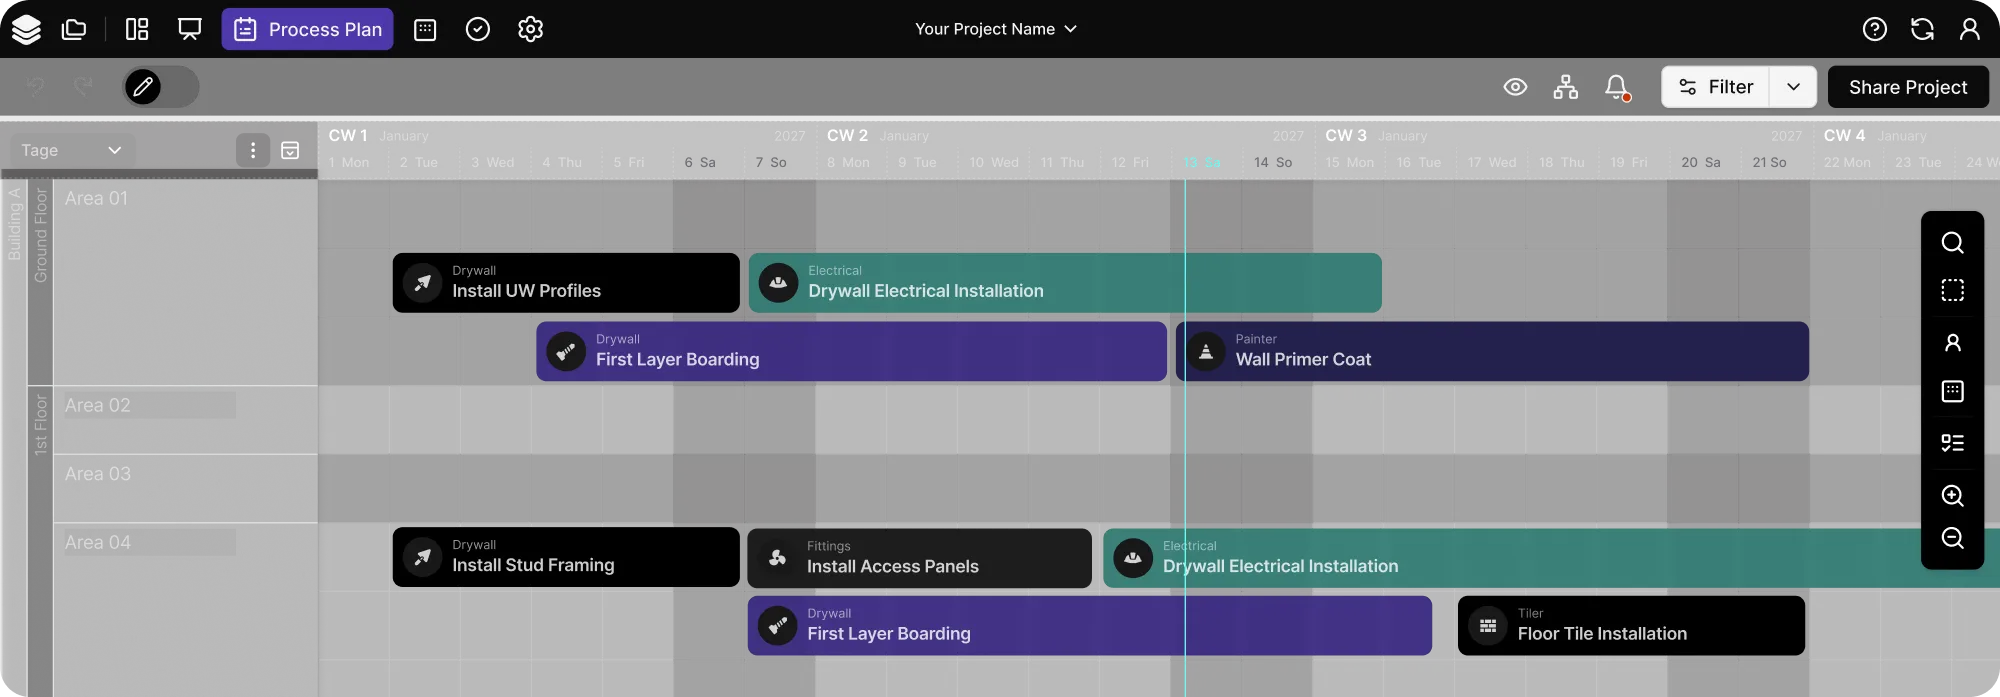
Value Stream Mapping is a visual tool used in lean management to analyze, and improve the flow of materials and information required to bring a product or service to a customer.
What is the ultimate purpose of Value Stream Mapping?
It provides a clear, visual representation of every step in your process. From the moment raw material arrives until the finished product reaches the customer, Value Stream Mapping captures it all.
This bird’s-eye view allows you to see where bottlenecks occur. You also uncover inefficiencies and locate various types of waste across multiple processes within the project.
By understanding these elements, VSM enables you to design a more efficient, streamlined workflow that not only reduces costs, eliminates waste but also enhances the overall value delivered to your customers. This can lead to significant price reduction and improved customer satisfaction. Ultimately, VSM helps transform your operations by focusing on continuous improvement and maximizing value creation.
Step into the future of optimized operations; let's master Value Stream Mapping process!
Why Bring Value Stream Mapping to Your Team?
Imagine walking through your production line and noticing piles of inventory waiting to be processed, workers moving around inefficiently, or products waiting for approval. These are clear signs of waste. Now, imagine being able to systematically eliminate these inefficiencies. That’s the power of VSM.
Benefits of Implementing Value Stream Mapping in Construction Projects
By using Value Stream Mapping, your team can:
- Visualize the entire process: See every step from start to finish.
- Identify bottlenecks and reduce waste: Find out where the process slows down or where resources are wasted.
- Design a more efficient future state: Create a plan for a streamlined, waste-free process.
- Implement improvements: Take actionable steps to achieve the future state.
Consider this: every step in your process that doesn’t add value is essentially waste. And waste, as you know, can drain resources, time, and money.
Value Stream Mapping aims to optimize your operations by pinpointing and eliminating waste, such as inefficient material handling, that do not align with customer demands. This approach not only optimizes value streams but also incorporates proven efficiency methods to boost overall performance.
The Historical Roots of Value Stream Mapping
Value Stream Mapping isn't a new concept; its roots are deeply embedded in the principles of lean manufacturing.
It first took shape under the Toyota Production System, a framework developed by Toyota to streamline manufacturing processes and reduce waste. The system emphasized creating more value with less work, an ethos that is to Value Stream Mapping central.
By thoroughly mapping out every step in the manufacturing process in response to customer demand, Toyota was able to identify inefficiencies and streamline operations across various business functions, setting a new standard in manufacturing efficiency.
Evolution and Adoption of Value Stream Mapping in Lean Manufacturing
Why Value Stream Mapping Still Resonates in Lean Manufacturing
So, why is Value Stream Mapping still a big deal in Lean manufacturing today? It’s simple: the principles that kicked off with Toyota haven't just survived; they've thrived.
Value Stream Mapping cuts through the clutter and helps you visualize each step, from raw materials to finished goods, and pinpoints where you’re losing time and resources in the material and information flow. Using stream map is like having a magnifying glass that spots where to zero in to ramp up efficiency and effectiveness. Impressive, isn't it?
The Expansive Impact of Value Stream Mapping
Well, Value Stream Mapping didn’t just stick to cars; it’s everywhere now, proving its worth across a spectrum of industries, from service industries and sectors like healthcare, software development, or retail.
So, what makes Value Stream Mapping so adaptable? It’s all about its core principle: making processes leaner and reducing waste. Industries have taken this idea and run with it, tailoring the approach to tackle their specific challenges.
Have you seen the impact of streamlining processes? It’s pretty significant—improving not just the bottom line but also boosting customer satisfaction. No wonder Value Stream Mapping has turned into a go-to strategy for any business that’s serious about refining their operations.
Software Engineering Simplified by Value Stream Mapping
Now, let’s talk about software engineering—ever noticed how managing process data can get pretty overwhelming? Here’s where value stream analysis really shines. It helps firms streamline both material and information flows. Especially in places where knowledge work occurs, such as software development, value stream maps are invaluable.
They lay out everything so you can see the workflows clearly and figure out where you can cut the fluff.
This strategic approach not only benefits external clients but also serves internal customers by improving service delivery within the organization.
Value Stream Mapping in Agile Frameworks
And what about applying Value Stream Mapping in agile environments?
Here, value stream maps serve as vital tools that allow team members to visualize complex tasks and workflows comprehensively. This visualization aids in making it easier for teams to adapt and evolve swiftly to changes, which is a core principle of agile methodologies.
Whether you’re using SAFe or another Agile method, integrating VSM ensures that all the processes—from development cycles to supply chain logistics—are optimized for maximum leanness, facilitating continuous improvement and swift adaptation to new challenges.
Core Concepts of Value Stream Mapping
Integration of Material and Information Flow in Value Stream Mapping
In Value Stream Mapping, both material and information flow are mapped to provide a comprehensive view of the entire process. This helps in identifying areas where materials are delayed or mismanaged and where information might be incomplete, inaccurate, or slow to move.
Material Flow Mapping
Material flow refers to the movement of physical items through the various stages of a production process. This includes the transportation of raw materials, work-in-progress (WIP) items, and finished goods. In Value Stream Mapping, material flow is represented to show how products move through the manufacturing or service process from start to finish. The aim is to identify and eliminate bottlenecks, reduce wait times, and streamline the physical movement of goods to increase efficiency.
Key Elements of Material Flow
- Raw Materials: The initial inputs required for the production process.
- Work-in-Progress (WIP): Items that are currently being processed or assembled.
- Finished Goods: Completed products ready for delivery to the customer.
- Transportation: The movement of these materials between different stages of the process.
- Storage: Areas where materials are held, either as raw materials, WIP, or finished goods.
Information Flow
It refers to the movement of data and information necessary to support and control the production process. This includes instructions, schedules, orders, and feedback that guide how materials should be processed. In VSM, information flow is mapped to understand how data travels through the organization and to identify inefficiencies, delays, or gaps in communication.
Key Elements of Information Flow
- Production Orders: Instructions detailing what needs to be produced, in what quantity, and by when.
- Schedules: Timelines and plans that coordinate the timing of different stages in the process.
- Communication: Information exchange between departments, teams, or individuals involved in the production process.
- Feedback Loops: Information that flows back from the process, such as quality checks, performance data, and customer feedback, which is used to make adjustments and improvements.
- Data Systems: Tools and platforms used to manage and transmit information, such as ERP systems, spreadsheets, or specialized software.
There are generally three main types of value stream maps, each serving a different purpose:
- Current State Map
- Future State Map
- Ideal State Map
1. Current State Map
The Current State Map is used to depict the existing process as it currently operates. This includes all the steps, materials, and information flows involved in delivering a product or service to the customer.
Application: This map helps in identifying bottlenecks, waste, and areas for improvement by providing a clear picture of the current state of operations.
2. Future State Map
The Future State Map outlines the optimized process after improvements have been made. This map aims to eliminate waste and streamline operations to enhance efficiency and value delivery.
Application: This map is used to plan and visualize the changes needed to achieve a more efficient and effective process. It serves as a roadmap for implementing improvements identified in the current state map.
3. Ideal State Map
The Ideal State Map represents the ultimate vision of the perfect process without any constraints. It depicts the best possible scenario with maximum efficiency and zero waste.
Application: This map serves as a long-term goal or vision for the organization. While it may not be immediately achievable, it provides a direction and aspiration for continuous improvement efforts.
Value Stream Map Essentials for Effective Practices
- Value Stream Analysis: Critical for dissecting each step and ensuring it adds value.
- Kaizen Events: Short-duration projects that implement quick, incremental changes beneficial in achieving the ideal state.
- Lean Techniques: Lean methodology, tools and strategies that support the continuous improvement of processes.
How to Start Value Stream Mapping Process
Streamlining your operations starts with a solid plan.
Creating an effective value stream map involves a series of well-defined steps, each essential to eliminate waste and identify areas for improvement in your operations.
But before we dive into the step-by-step guide, let's clarify what really counts in your process:
- Value-Adding Steps: These are the actions your customers are actually paying for, the ones that directly contribute to the product or service.
- Non-Value-Adding Steps (Waste): These steps consume resources but don't add value from the customer's perspective.
Now, here’s how you can go about it and create a value stream map:
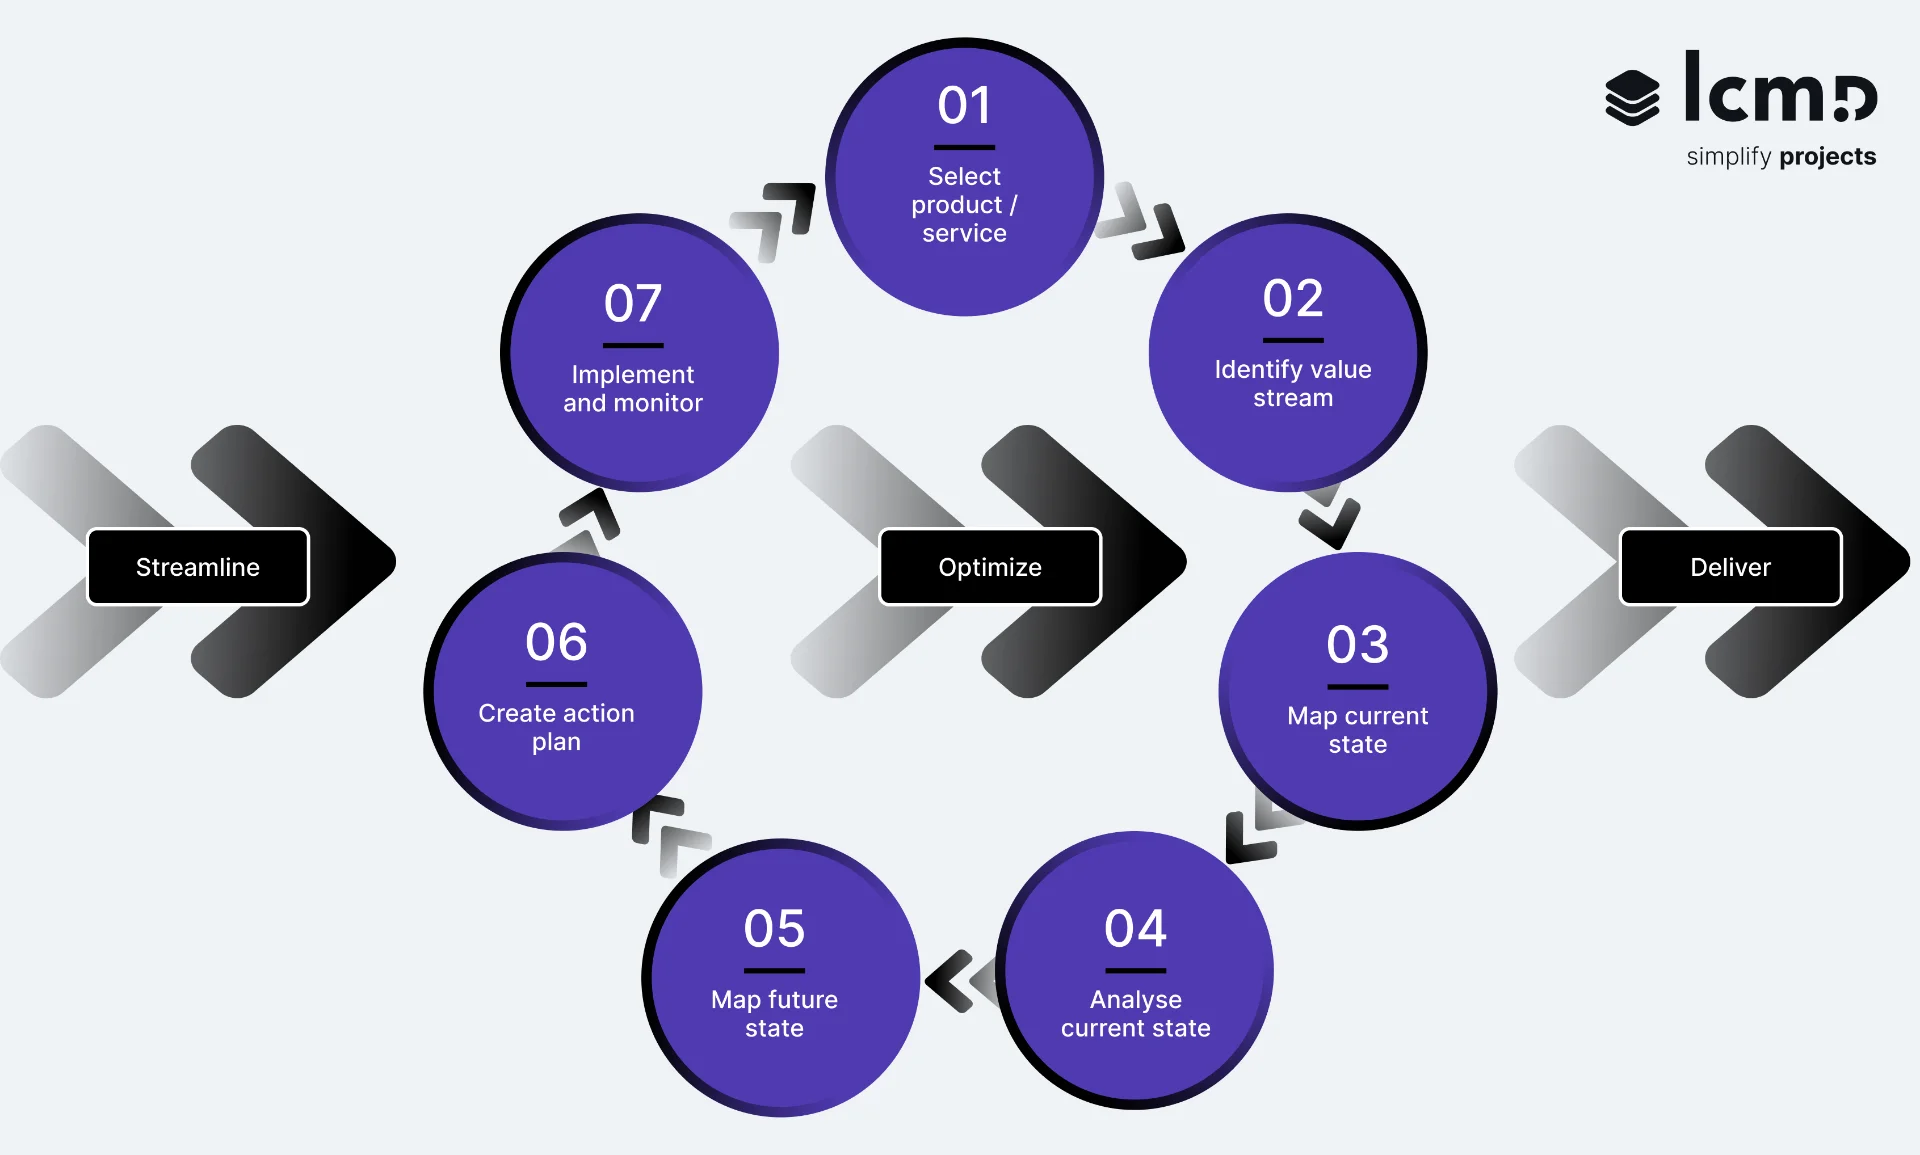
1. Select the Product or Service Family
Start by defining the scope of the process or product family. This initial step helps in focusing the mapping efforts and sets the stage for more detailed analysis to collect process data.
2. Identify Value Stream
Identify and document the complete flow of materials and information through the process. This includes using standardized stream mapping symbols within an information flow diagram to represent different process steps and flows clearly.
3. Map the Current State
- Observe the Process
Track the the material flow and information flow through the process, documenting every process step to guarantee thorough value stream analysis.
- Use Common Symbols
Utilize standard stream mapping symbols to represent different process steps and flows within an information flow diagram.
- Identify Lean Waste
During this phase, pinpoint all 8 types of waste. Information flow mapping can be particularly useful here to trace how data moves through the system, essential for stream mapping aims.
- Address Lean Waste
Develop strategies for reducing or eliminating identified wastes, applying process mapping techniques to refine and optimize each process step.
4. Analyze Current State
Analyze the current state map to uncover inefficiencies and areas that require changes or enhancements. Pay special attention to cycle time, lead time, and wait time.
- Cycle Time is the total time taken to complete a specific process or task from start to finish. This includes the actual working time on the task but excludes any waiting periods.
- Lead Time it the total time taken from the initiation of a process to its completion. This includes both the cycle time and any waiting time, covering the entire duration from order to delivery.
- Wait Time is the amount of time that a product or material spends waiting between process steps. This is considered non-value-adding time and is a key area for identifying and reducing inefficiencies.
5. Create the Future State Map
Design the future state map to depict a more efficient process with improved material and information flows, ensuring all identified improvements are clearly represented.
6. Develop Action Plan
This final step involves setting out a detailed plan to achieve the desired process improvements, including timelines, resources, and specific actions to be implemented. This plan serves as a blueprint for continuous delivery.
7. Implement and Monitor
Finally, implement the action plan and continuously monitor the process. Use the feedback to make adjustments and iterate on the mapping to further refine and optimize the operations.
Tools and Symbols in Value Stream Map
Value Stream Tools and Software for Optimized Mapping Process
When diving into Value Stream Mapping, having the right tools can make all the difference. So, what should you use?
Creation of Value Stream Map
- Diagramming Software (e.g., Microsoft Visio, Lucidchart): These visual tools provide robust functionalities for drawing accurate maps with templates, symbols, and features that meet VSM standards. They make it easier to visualize process steps and flows.
- Whiteboards and Markers: Essential in collaborative settings like workshops, allowing teams to dynamically contribute ideas and make real-time adjustments during the mapping phase.
Data Collection and Stream Analysis
- Excel and Minitab: Utilized for compiling and analyzing process data, helping in decision-making with capabilities to perform complex statistical analyses related to production volume.
- Value Stream Mapping Software: Goes beyond traditional diagramming by incorporating data analysis directly within the map, offering automated insights for stream analysis and process improvement.
Communication and Collaboration
- Online Collaboration Tools (e.g., Lucidchart, Google Workspace): Facilitate seamless sharing and collaboration on VSM projects, so that all team members, regardless of location, stay updated.
- Lean Management Software: These tools integrate various functionalities essential for effective communication and collaboration. They provide centralized communication, workflow automation, and document control, ensuring that everyone works from the latest information. This software also offers project tracking and reporting features, helping teams measure progress and adjust plans as needed. All functions are designed to consistently support the principles of lean management.
- Presentation Tools (e.g., PowerPoint): Useful for formalizing and presenting the findings from VSM to stakeholders in a clear and structured format, often utilizing information flow diagrams.
Continuous Improvement and Monitoring
- Process Monitoring Tools: Advanced features in some Value Stream Mapping tools allow for ongoing tracking of improvements and alert notifications when deviations occur, promoting timely corrective actions.
Value Stream Map Symbols
While tools facilitate the creation of a value stream map, symbols are strategically placed within these maps to represent specific elements of the manufacturing or service process.
Generally, symbols of value stream map are divided into groups based on their function within the map. These groups are widely recognized and their standardized nature helps in maintaining consistency and understanding across different teams or even external stakeholders who are familiar with stream map practices.
Symbol Categories in Value Streams
VMS symbols are typically grouped into the following categories:
- Process Symbols
- Material Symbols
- Information Symbols
- General Symbols
- Kaizen Burst Symbols
Integrating Six Sigma for Advanced Value Stream Mapping
How does Six Sigma fit into this picture?
Stream maps can be seen as a visual complement to the rigorous data-driven approach of Six Sigma. Combining the two means spotting problems and solving them with precision.
Key Integrations
- Data Boxes and Process Steps
- Six Sigma's focus on data boxes to capture metrics such as cycle time, lead time, and wait time at each process step enriches the VSM’s visual layout.
- Line Optimization
- By aligning Six Sigma tools with VSM, line workers and team members can significantly reduce inefficiencies, directly enhancing line improvement and continues delivery.
- From Visualization to Implementation
- The integration facilitates a robust implementation plan that maps out and also executes quality enhancements across production stages, so that every process step contributes effectively to the finished product.
Dual Benefits
- Defect Minimization and Quality Maximization
- Marrying these methodologies ensures defects are minimized and quality across the process steps is maximized—critical for meeting customer demand.
- Efficient Resource Management
- This strategic approach optimizes resource allocation and usage, significantly impacting production timelines and customer satisfaction.
{{cta}}
Conclusion
A value stream mapping diagram is like the blueprint of your business processes, showing how materials and information flow from start to finish.
It identifies the kinks in your system and shines a light on where exactly your process can be tightened up. Value stream maps give you the lowdown on inefficiencies and guide you on reimagining a more optimised future state.
Value stream map assists team members in visually identifying bottlenecks and streamline processes, ultimately boosting continuous delivery. It also clarifies how each step contributes to producing customer value, securing that every part of the workflow aligns with the goal to produce customer satisfaction.
Effective, efficient, and adaptable—aren’t these the marks of a high-performing team?